The Executors Tab: Diagnosing Resource Bottlenecks
If the Jobs and Stages tabs tell you which piece of work is slow, the Executors Tab tells you why — it's the hardware-level view of the Driver and every active Executor, and it's your first stop for anything that smells like a memory or network problem.
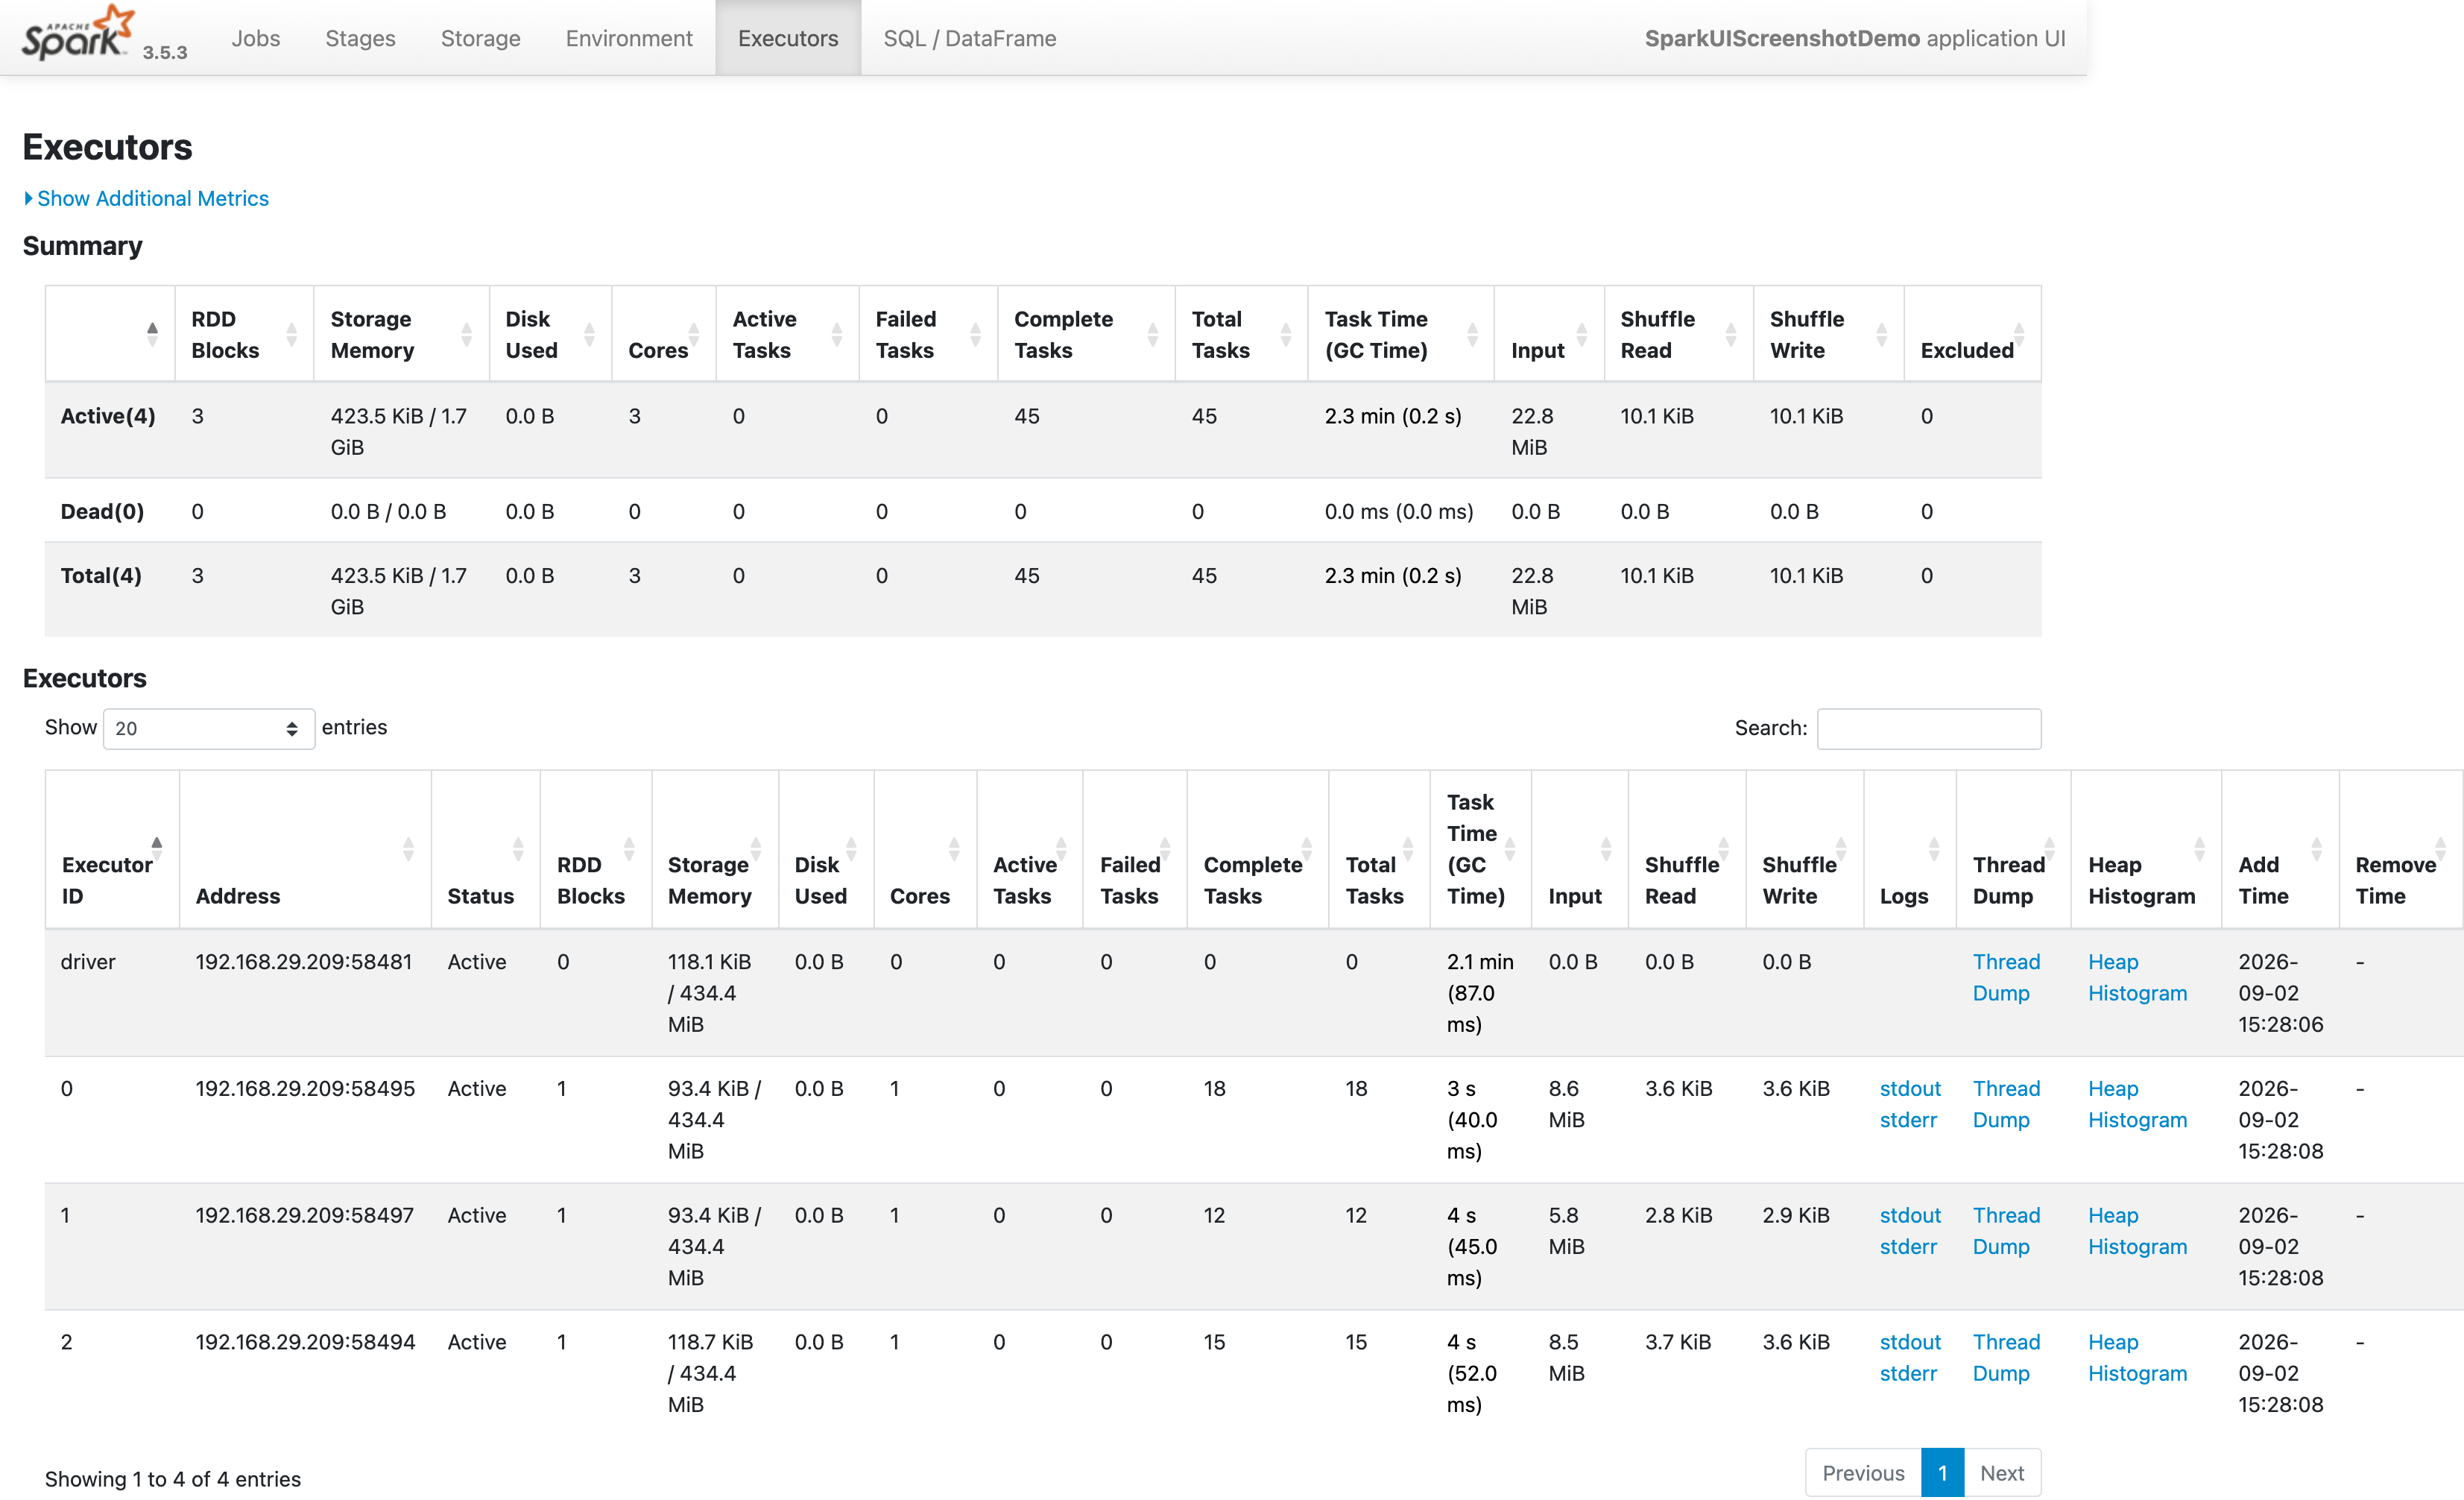 Figure 1 — Executors Tab: the Driver plus 3 real Executors, with per-executor task counts, GC time, and shuffle read/write.
Reading the Executors Table
- Storage Memory (used / total): How much of the executor's memory pool is currently holding cached RDDs/DataFrames. Spark splits executor memory into a Storage region and an Execution region that can borrow from each other — if this number is near its total and you're also seeing task failures, cached data may be getting evicted mid-job, forcing expensive recomputation.
- Task Time (GC Time): Shown as a fraction of total task time, e.g.
4.2 min (45 s). The single most important ratio on this page — if GC Time is more than roughly 10% of Task Time, the JVM is spending too much of its time reclaiming memory instead of doing work. That's a sign the executor is under memory pressure: too many objects being created (often from inefficient UDFs), or--executor-memoryset too low for the partition size. - Shuffle Read / Shuffle Write: Bytes transferred across the network per executor. If one executor's shuffle read is dramatically larger than the others, that executor is on the receiving end of a skewed key — cross-reference with the Stages tab's task duration outliers.
- Active / Failed / Complete Tasks: A steadily climbing Failed Tasks count on one specific executor (rather than spread evenly) usually points at bad hardware or a disk running out of space on that specific node, not a code problem.
- Blacklisted / Dead executors: An executor that disappears from the "Active" list mid-run was most likely killed by YARN/Kubernetes for exceeding its memory limit (see Scenario: Memory Intensive Join for the container-overhead math), or lost its heartbeat due to a long GC pause.
A Worked Diagnostic Example
Say a job is running 3x slower than last week with no code changes. On the Executors tab you see:
- GC Time is 22% of Task Time on 4 out of 12 executors, but near 0% on the rest.
- Those same 4 executors show much higher Shuffle Read than the others.
Together, these two signals point at data skew feeding a small number of executors more data than they can comfortably hold — the extra data forces more garbage collection while those executors churn through a disproportionate share of the work. The fix lives on the data side (salting the skewed key, or letting Adaptive Query Execution's skew join optimization handle it), not on the hardware side — throwing more --executor-memory at 4 overloaded executors while the other 8 sit idle just delays the same failure.
Caution
Resist the urge to fix every slow job by increasing --executor-memory. If the Executors tab shows the imbalance concentrated on a handful of executors rather than spread evenly across all of them, you have a skew problem, and more memory only buys you a temporary reprieve before the next larger run OOMs again.
Environment & Storage: Verifying What Actually Ran
Two tabs live right next to Executors and are easy to overlook:
- Environment Tab: A full dump of every active Spark config, JVM system property, and environment variable as the Driver actually resolved them. When a
--confflag you passed tospark-submitdoesn't seem to be taking effect, this is the tab that tells you whether it was ever applied, silently overridden by a cluster default, or simply misspelled. - Storage Tab: Every RDD/DataFrame you called
.cache()or.persist()on, its Storage Level (e.g.Memory Deserialized 1x Replicated), the fraction currently cached, and its size in memory vs. on disk. If a downstream stage is re-reading from source instead of using your cache, this tab will show the cached fraction dropped below 100% — meaning some partitions were evicted under memory pressure.