Introduction to Spark UI
"Master the Spark Web UI to understand running jobs and troubleshoot performance issues with confidence."
What You'll Master
Submission Lifecycle
How code turns into a running Job: SparkSession init, lazy DAG construction, Catalyst optimization, & task scheduling.
Jobs & Executors Tabs
Reading the event timeline & DAG visualization, plus JVM heap, GC time, and shuffle read/write per executor.
SQL Tab & Physical Plans
Tracing the physical execution DAG, operator-level row/spill metrics, and spotting shuffle vs broadcast joins.
Diagnosing Skew & Bottlenecks
Using the Stages, Storage & Environment tabs to catch data skew, cache pressure, and misapplied configs.
The Spark Web UI is the most powerful diagnostic tool available to a Spark developer. It provides a real-time, visual window into the internals of your running Spark application, helping you monitor performance, debug failures, and identify bottlenecks (like data skew, garbage collection overhead, or excessive serialization).
The Life Cycle: What Happens When Code is Submitted?
Understanding the interaction between your code, the driver, the executors, and the Web UI is critical to mastering Spark. Here is the step-by-step lifecycle of a Spark submission and how the Web UI renders it:
flowchart TD
    subgraph S1["1-2 . Submission and Lazy Planning"]
        direction LR
        A["Submit Code"] --> B["Init SparkSession"] --> C["Driver Starts Web UI :4040"] --> D["Lazy Transformation"] --> E["Appended to Lineage DAG"]
    end
    subgraph S2["3 . Action Triggers a Job"]
        direction LR
        F["Action Triggered"] --> G["Catalyst Builds Physical Plan"]
    end
    subgraph S3["4-5 . Scheduling and Live Monitoring"]
        direction LR
        H["DAGScheduler Creates Stages"] --> I["TaskScheduler Launches Tasks"] --> J["Executors Send Heartbeats"] --> K["Web UI Renders Live Metrics"]
    end
    S1 --> S2 --> S3
Figure 1 — The Spark submission lifecycle, from code submission through to live metrics on the Web UI.
1. SparkSession Initialization & Driver Web Server
When you submit a Spark application (using spark-submit or running a cell in a notebook), the Driver process is launched. One of the very first things the Driver does is initialize the SparkContext.
- During this initialization, the driver starts a local, embedded Jetty web server.
- By default, it binds to port
4040(e.g.,http://localhost:4040). - Note: If another Spark application is already running on port 4040, Spark will automatically increment the port (4041, 4042, etc.) until it finds an open one.
2. Lazy Execution & DAG Construction
Spark transformations (like .map(), .filter(), or .groupBy()) are lazy. They do not trigger actual computation; they merely build up a Logical Plan (represented as a Directed Acyclic Graph or DAG of operations).
- During this phase, the Web UI remains idle, showing no active jobs.
3. Action Triggering & Physical Optimization
The moment you invoke an Action (such as .count(), .collect(), .show(), or .write()), the Driver triggers a Spark Job.
- Under the hood, Spark's Catalyst Optimizer takes the logical plan and optimizes it, generating a highly efficient Physical Execution Plan.
- The SQL Tab in the Web UI immediately updates to render this physical plan.
4. Job Scheduling (DAGScheduler & TaskScheduler)
The optimized plan is handed to the DAGScheduler:
- The
DAGSchedulerdivides the Job into Stages based on shuffle boundaries (wide transformations likejoinorgroupByKeyrequire data movement and split stages; narrow transformations likemaporfilterare pipelined together in the same stage). - The
TaskSchedulerthen takes the stages and breaks them down into individual Tasks (one task per data partition). It schedules these tasks and sends them to the Executors for physical execution.
5. Heartbeat & Real-Time Metrics Rendering
As tasks run on the executors, the executors continuously send Heartbeat messages back to the Driver (every 10 seconds by default).
- These heartbeats carry critical metrics: CPU utilization, JVM garbage collection time, memory usage, bytes read/written, and shuffle write sizes.
- The Driver gathers these metrics and feeds them to the Web UI, updating the Jobs, Stages, and Executors tabs in real-time.
Deep-Dive: Key Web UI Tabs Explained
Let's explore the core screens of the Web UI using actual renders of running applications.
1. The Jobs Tab (Global Overview)
The Jobs Tab is the landing page of the Spark UI. It provides an event timeline of all active, completed, and failed jobs.
Note
A single Spark application can run multiple Jobs. Each Job corresponds to exactly one Action called in your code.
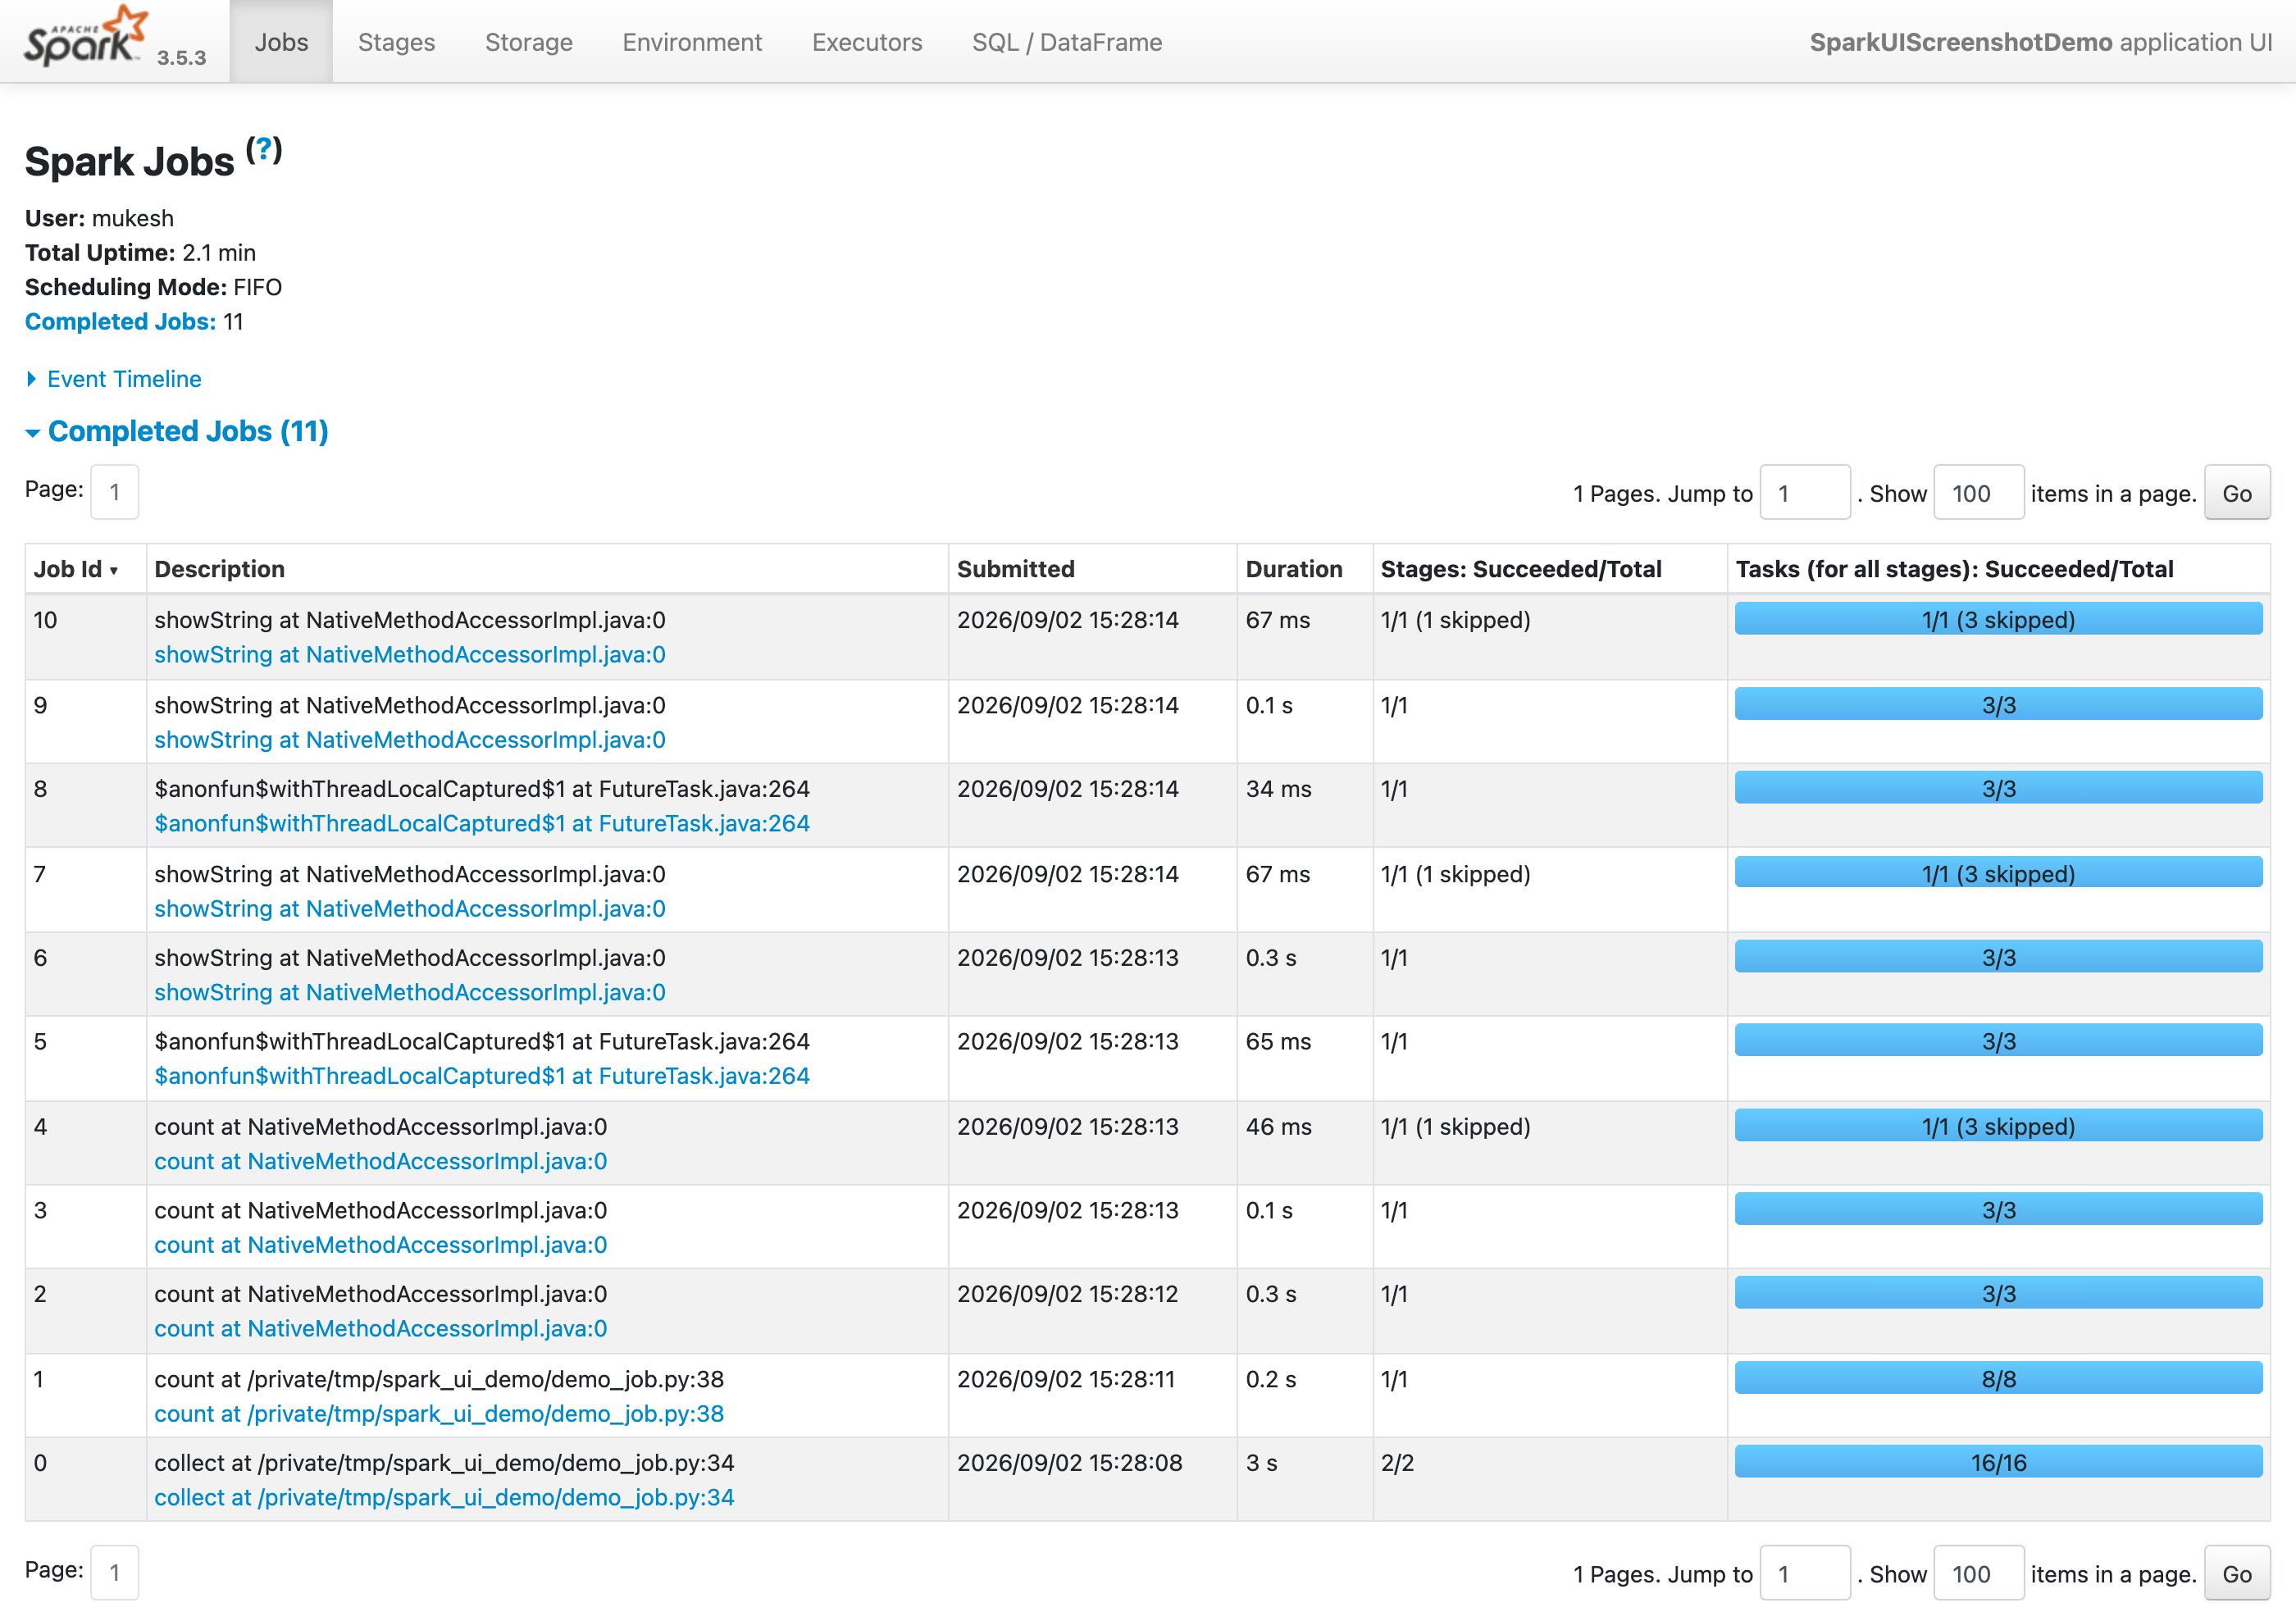 Figure 2 — Jobs Tab: every Job in a running application, with stage and task progress.
Key Features to Watch:
- Event Timeline: Shows when executors were added or removed and when specific jobs started and finished.
- DAG Visualization: Displays the sequence of RDD/DataFrame transformations grouped into Stages. You can visually trace how data flows from your source (e.g., a Parquet file scan) through transformations like
flatMap,map, andfilter, and where stage boundaries (vertical lines marked "Shuffle") occur. - Succeeded/Total Stages: Displays task execution progress so you can instantly see if a stage is bottlenecked or stuck.
» Full walkthrough: The Jobs & Stages Tabs
2. The Executors Tab (Resource Monitoring)
The Executors Tab provides hardware-level statistics for the Driver and all active Executors. It is your primary tool for diagnosing hardware bottlenecks and resource exhaustion.
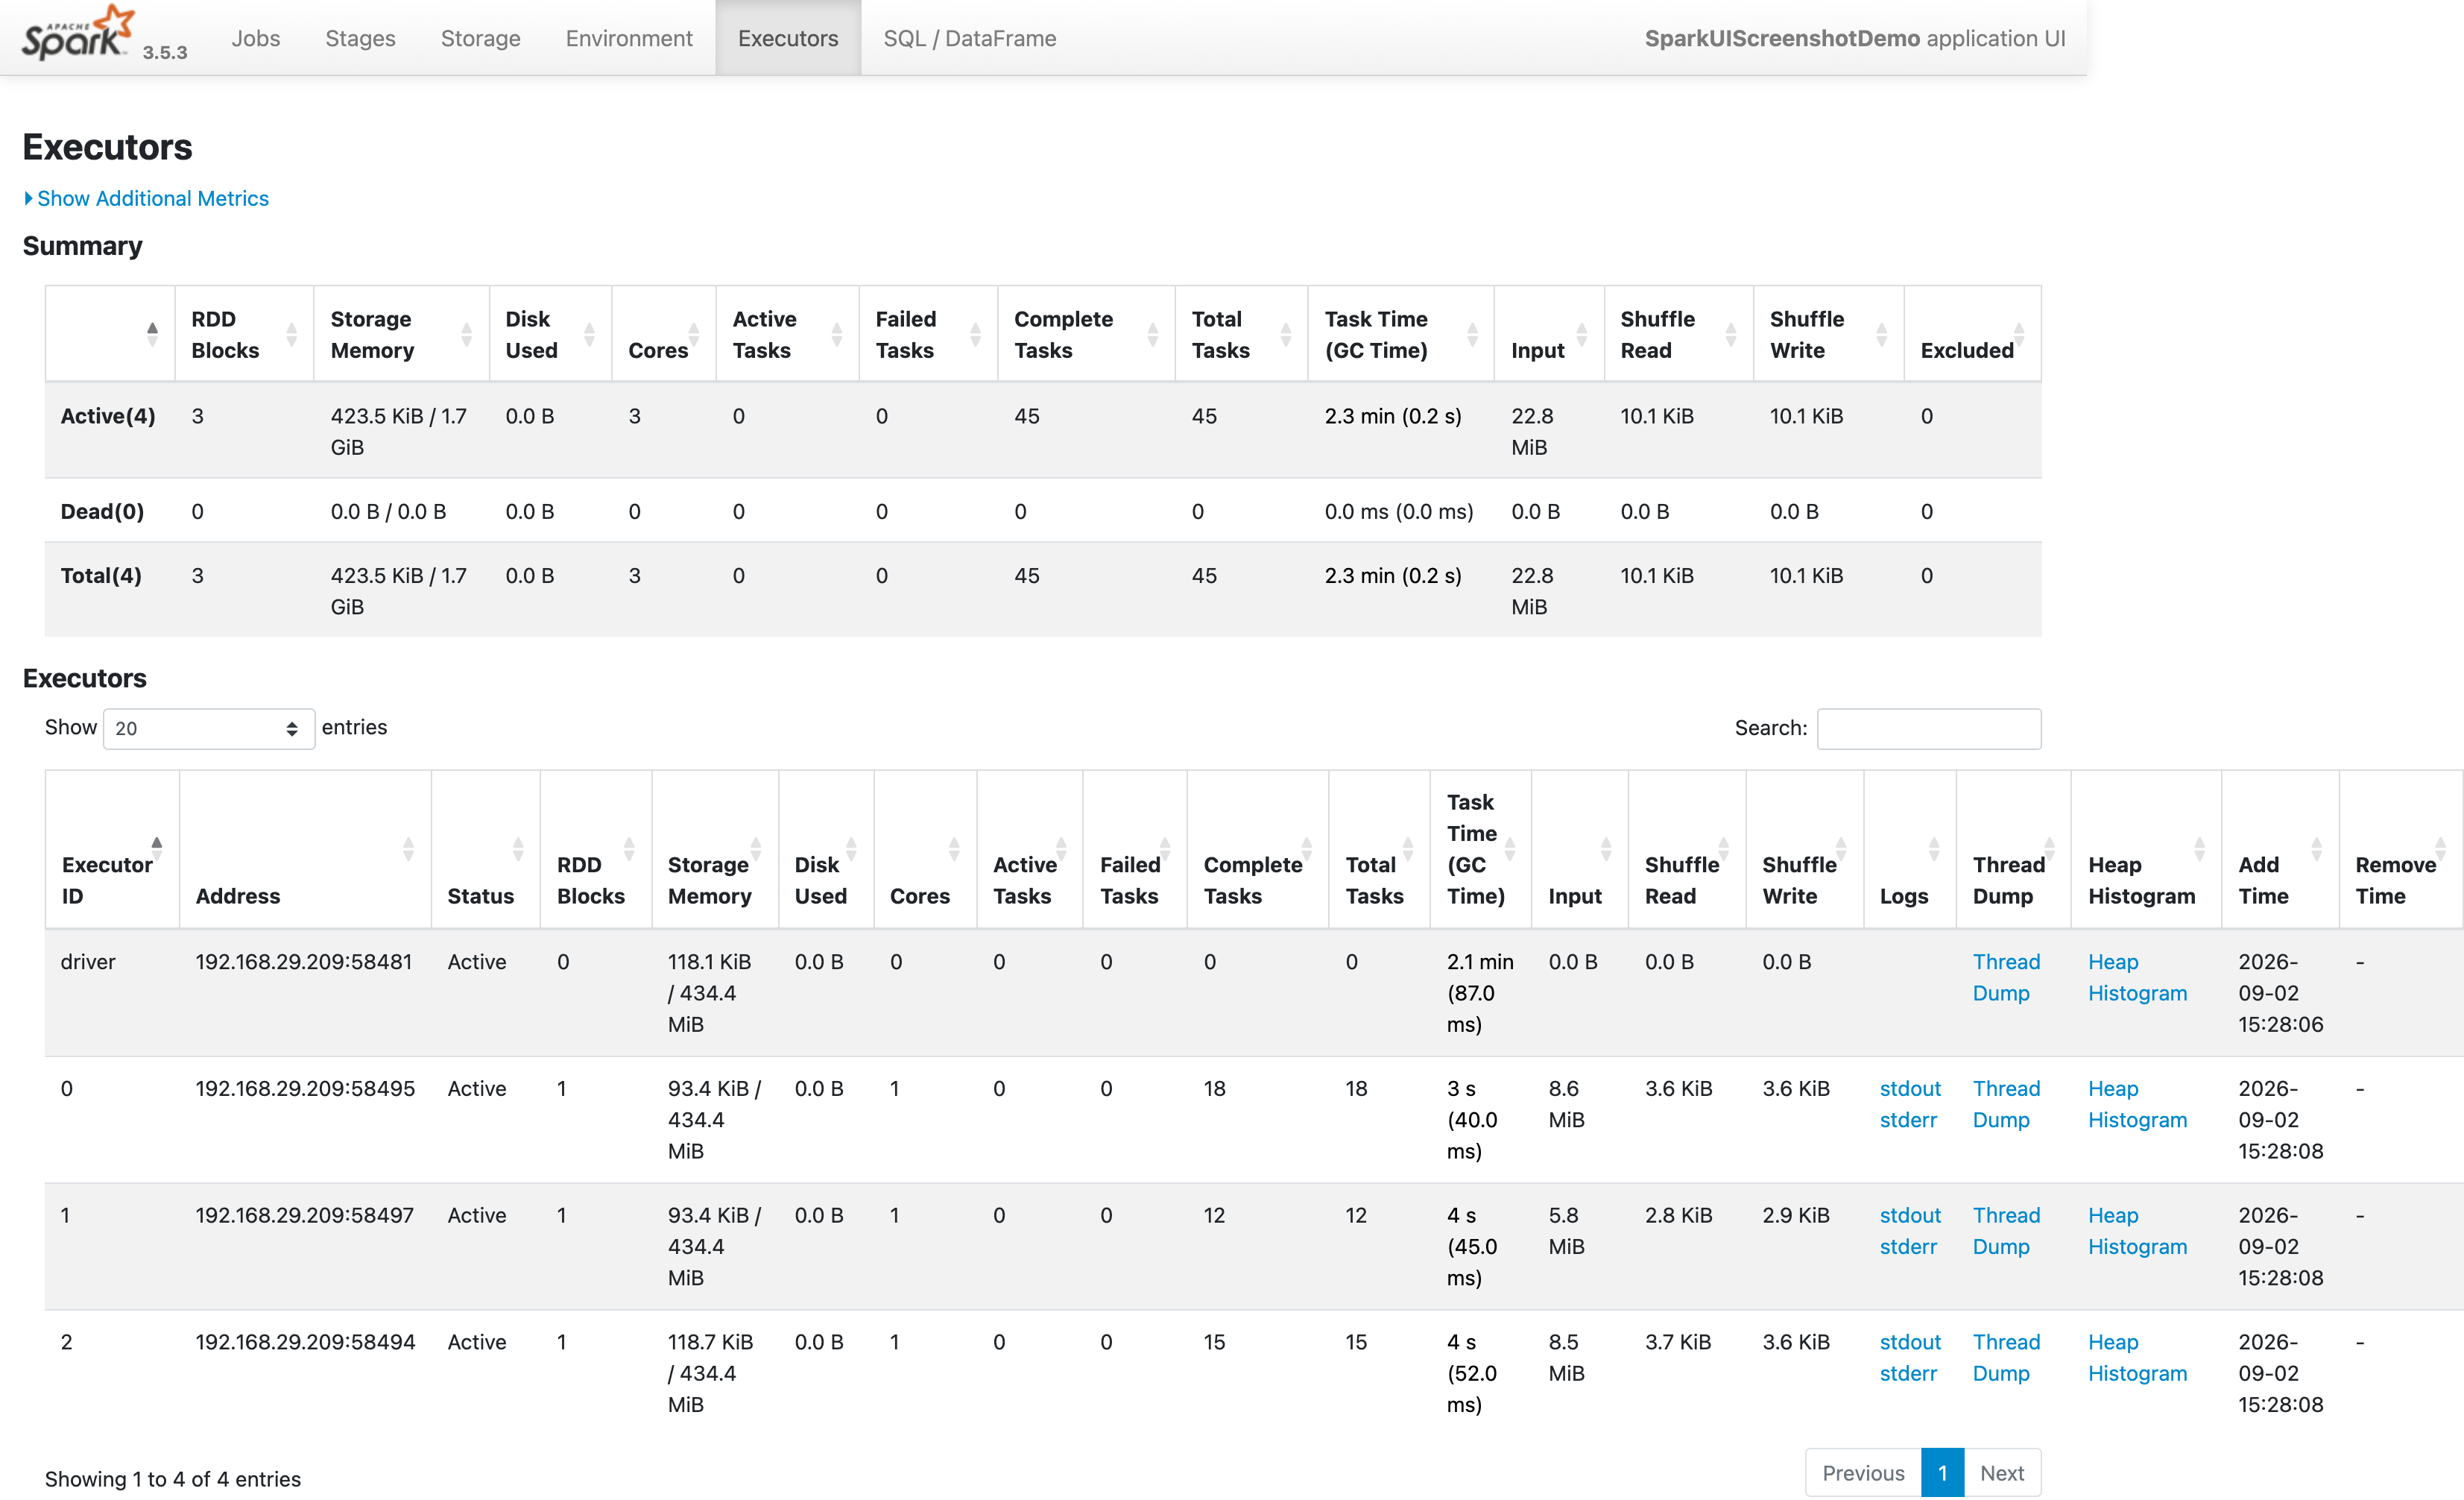 Figure 3 — Executors Tab: per-executor resource usage, GC time, and shuffle read/write.
Key Features to Watch:
- JVM Heap Memory Usage: Displays the exact memory allocated for execution and storage, along with JVM garbage collection (GC) metrics.
- GC Time / Executor Run Time: If GC time represents more than 10% of the total executor run time, it is a warning sign that executors are running low on memory, forcing the JVM to spend excessive time reclaiming space.
- Shuffle Read / Shuffle Write: Shows how much data each executor is transferring across the network during wide transformations. Uneven shuffle distribution is a clear indicator of Data Skew.
» Full walkthrough: The Executors Tab
3. The SQL Tab (Execution Optimizer)
The SQL Tab shows detailed execution trees for structural API queries (DataFrames and Spark SQL). It bridges the gap between your high-level code and physical execution.
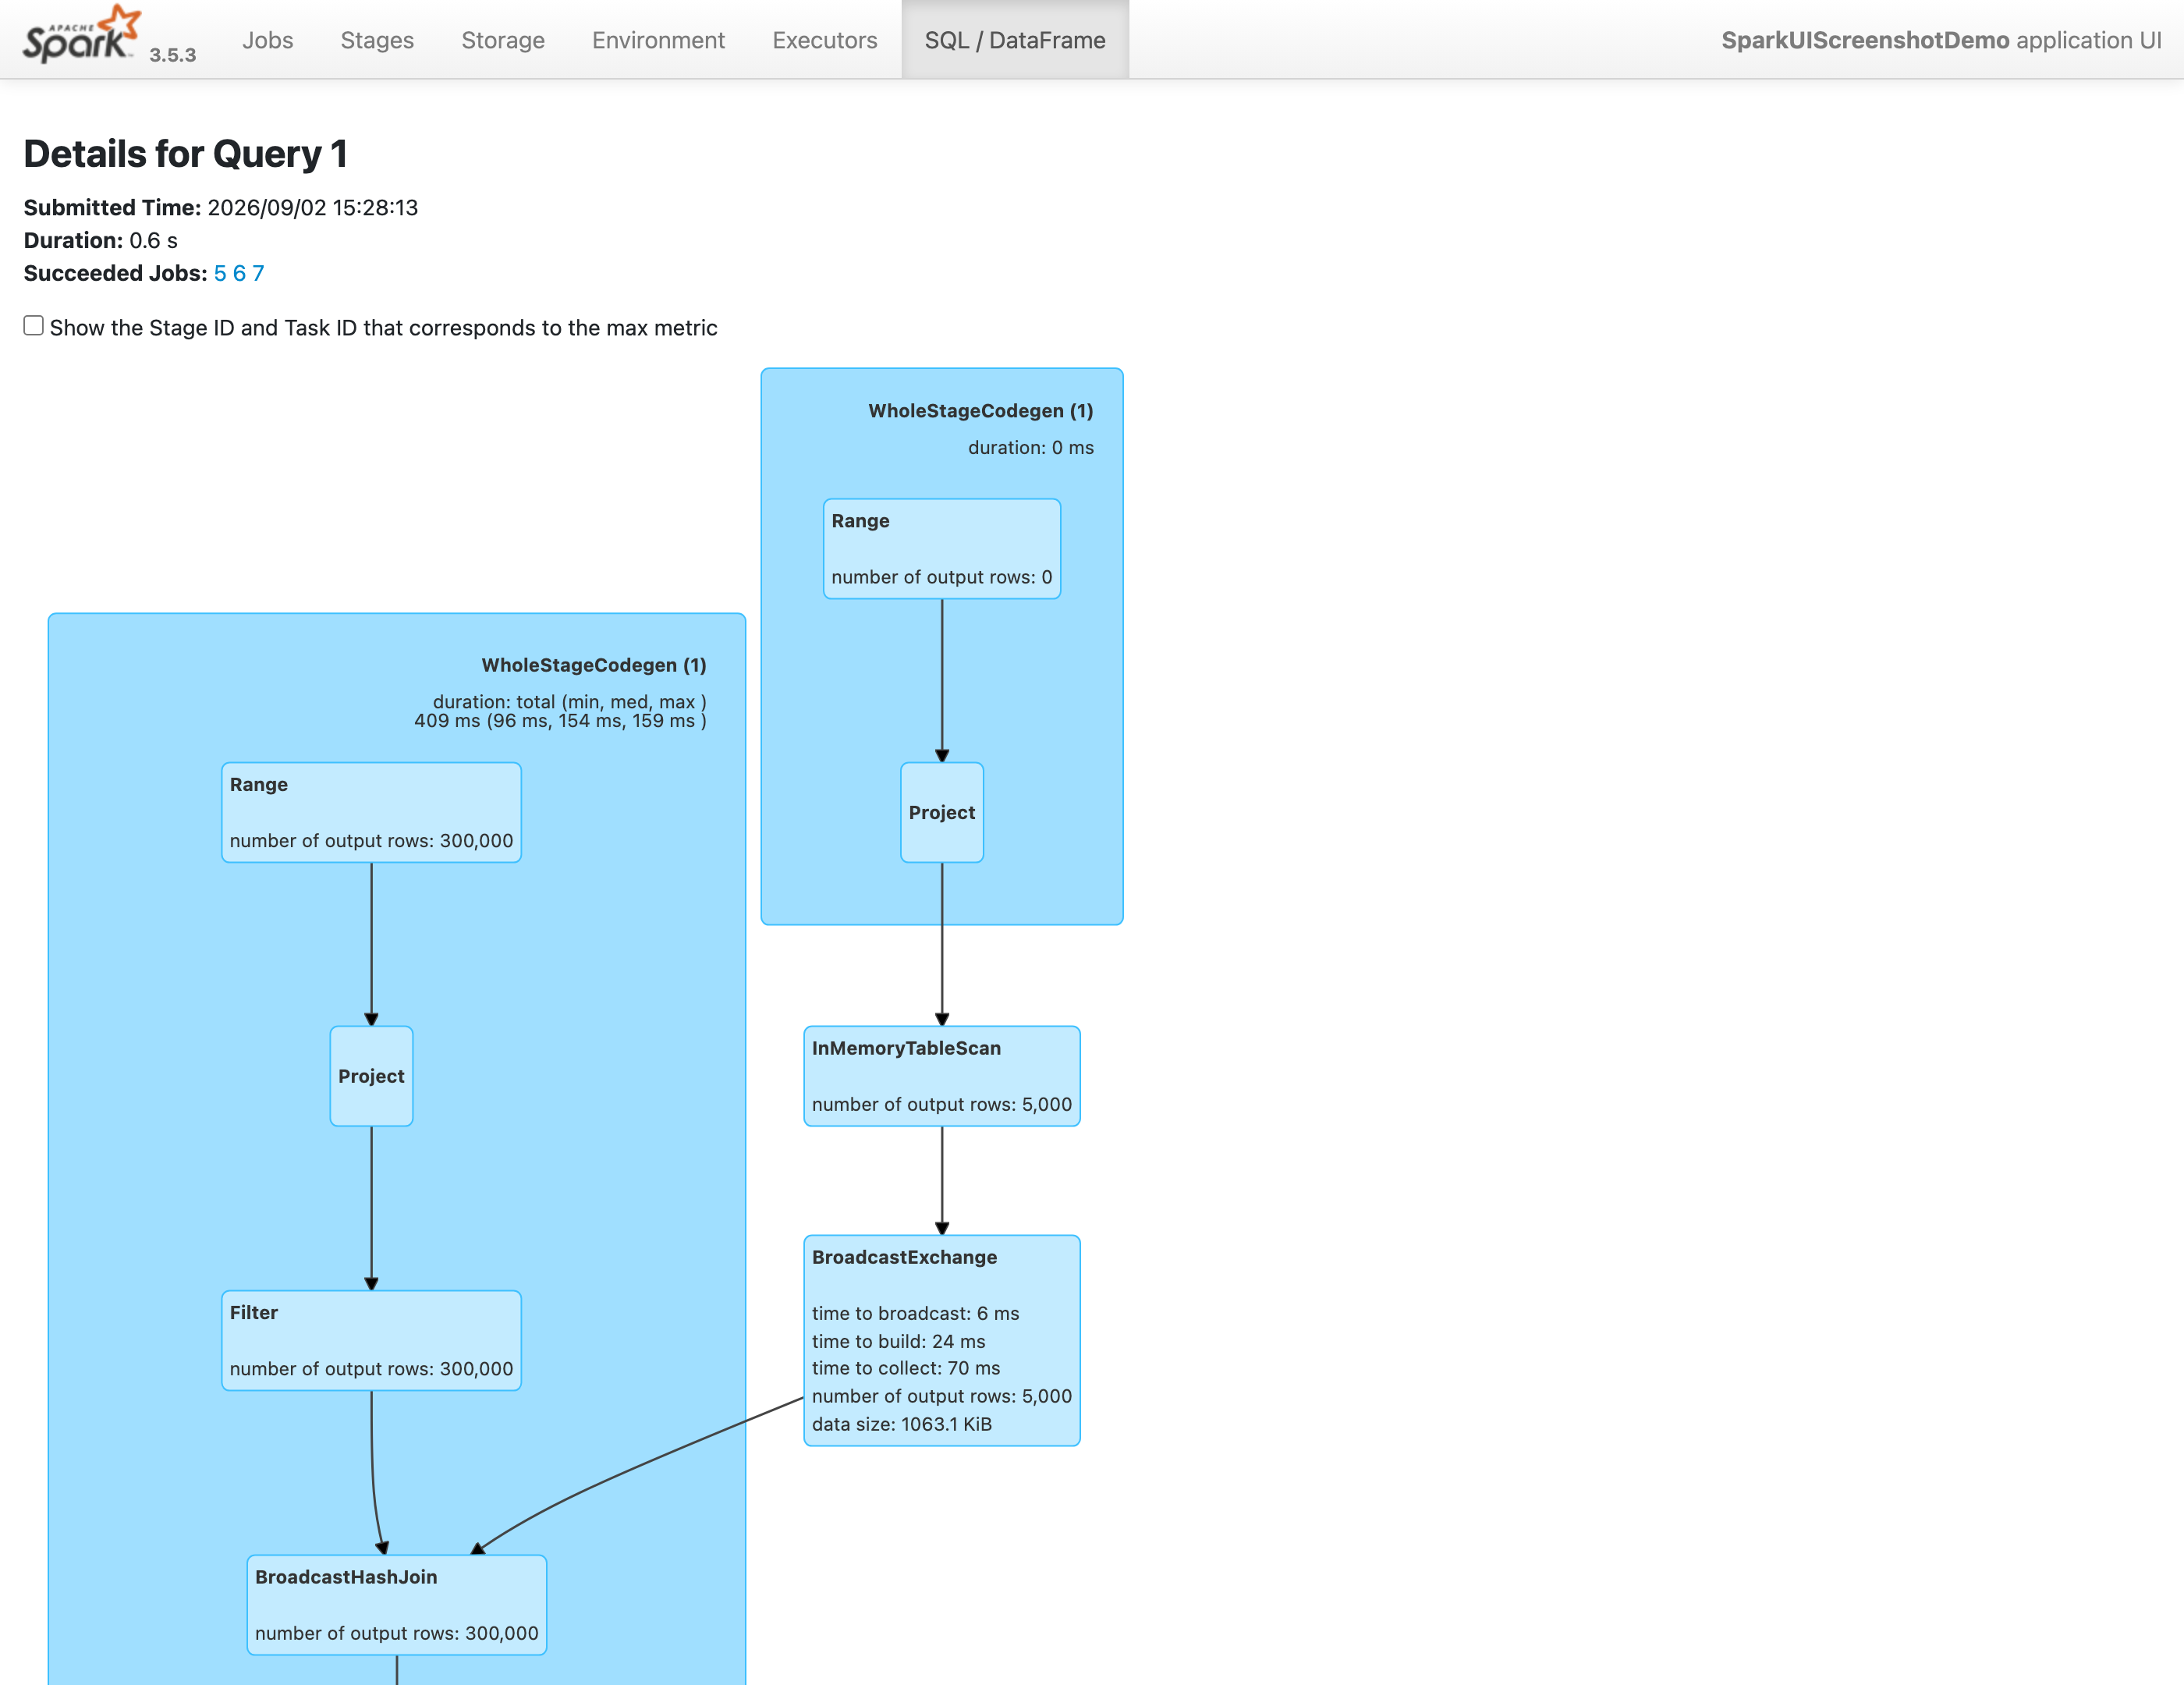 Figure 4 — SQL Tab: the physical execution plan Catalyst generated for a DataFrame join.
Key Features to Watch:
- Physical Plan DAG: Every node in this interactive graph represents a physical execution operator (e.g.,
FileScan parquet,Filter,Project,BroadcastExchange, andBroadcastHashJoin). - Operator Metrics: Renders real-time statistics directly inside each node, such as:
- Number of output rows
- Scan time
- Spill sizes (memory/disk)
- Join Details: Instantly verify if Spark is using an optimal join strategy (like a super-fast
BroadcastHashJoin) or falling back to a slower, resource-heavy shuffle-based join.
» Full walkthrough: The SQL Tab
4. Additional Crucial Tabs
- Stages Tab: Drill down into a specific stage to inspect task distribution. If a few tasks are taking hours while the rest finish in seconds, you have identified a Data Skew or an uneven partition size.
- Storage Tab: Displays cached or persisted DataFrames/RDDs. It shows the memory fraction cached, storage level (e.g.,
Memory and Disk Deserialized 1x), and size on disk/memory. - Environment Tab: Displays all runtime configurations, active environment variables, JVM system properties, and specific Spark configurations (
spark.driver.memory,spark.sql.shuffle.partitions, etc.). Use this to verify that your cluster configuration changes have actually taken effect!
» Full walkthrough: Stages, Storage & Environment Tabs
Summary: Diagnostic Cheat Sheet
Learning Path & Course Syllabus
Reading the DAG visualization, spotting shuffle boundaries, and diagnosing skew from the task duration summary.
Diagnosing GC pressure, uneven shuffle load, and dead executors with a worked example.
Reading physical plan operators, spotting missed broadcast joins, and interpreting spill metrics.
Confirming skew across an entire run, verifying your cache is actually cached, and checking which configs really took effect.
Practical exercises reading real Jobs, Executors, and SQL tab screenshots to spot bottlenecks.
Conceptual questions on DAG scheduling, shuffle boundaries, and diagnosing skew from UI metrics.
What's Included in This Module
| Component | Coverage Details |
|---|---|
| Core Topics | Driver & Executor Architecture, Cluster Managers, Datasets |
| Practical Exercises | Interactive Hands-on Labs & Spark Tasks |
| Assessments | 1 Practical Assignment + 1 System Design Interview Quiz |